5-Point True to False Equivalence Scale
This scale refines the earlier Similarity-Variation Spectrum into a concise 5-point taxonomy-based framework for evaluating claims of equivalence between two entities (e.g., ideas, actions, or phenomena). It draws from a comparative taxonomy structured around four key input dimensions:
- Core Attributes (e.g., purpose, mechanisms—40% weight): Fundamental shared traits.
- Contextual Factors (e.g., scale, stakeholders—30% weight): Environmental and relational elements.
- Outcomes/Impacts (e.g., effects, measurability—20% weight): Results and implications.
- Historical/Ethical Nuances (e.g., origins, moral framing—10% weight): Temporal and value-based layers.
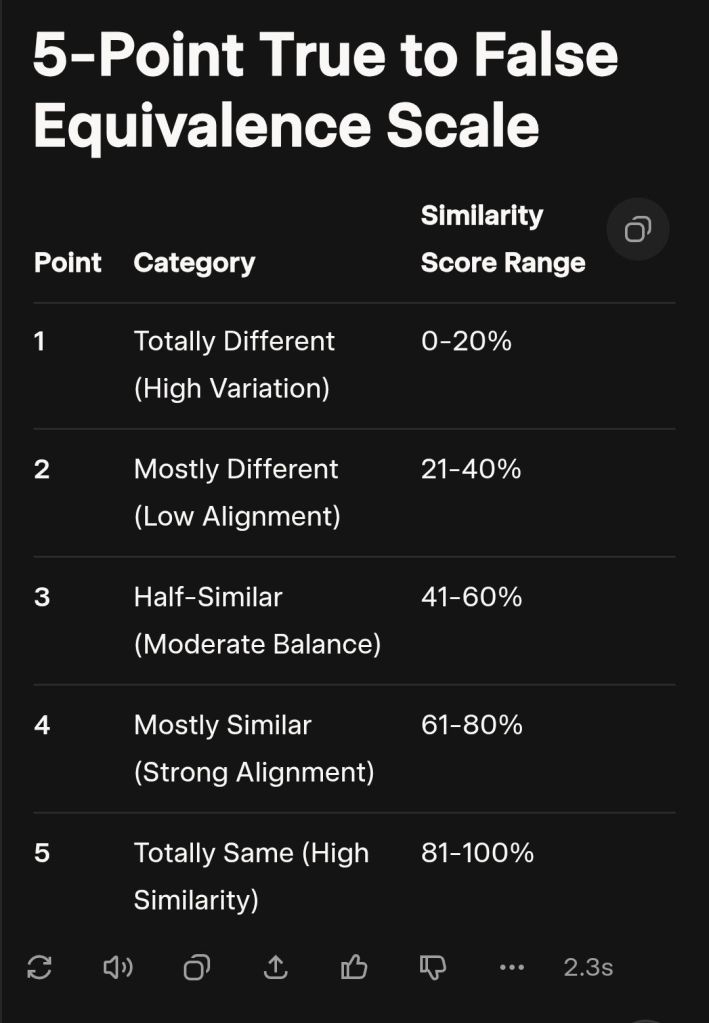
Scoring Process: Assign similarity scores (0-100%) per dimension based on overlap (e.g., exact match = 100%, no match = 0%). Compute a weighted total: (Core × 0.4) + (Context × 0.3) + (Outcomes × 0.2) + (Nuances × 0.1). Map to one of the 5 points. Claims of “same” at ≤3 points indicate false equivalence risk; ≥4 points suggest true equivalence. This taxonomy ensures systematic, evidence-based assessment to avoid subjective bias. Point Category Similarity Score Range Description & Taxonomic Inputs Equivalence Validity Example 5 Totally Same (High Similarity) 81-100% Entities are functionally identical across all dimensions: Core attributes mirror exactly (e.g., same purpose/mechanisms); contexts are interchangeable; outcomes align perfectly; nuances reinforce unity. No meaningful variation. True (Full validity; comparison enhances precision.) iPhone 15 vs. iPhone 15 Pro (base models): Same OS, hardware core, user ecosystem—minor tweaks don’t alter essence. 4 Mostly Similar (Strong Alignment) 61-80% High overlap in 3+ dimensions (e.g., core and outcomes dominant), with minor contextual/nuance tweaks. Variations are superficial, not structural. Mostly True (Valid analogy; “akin to” is apt, but specify diffs for accuracy.) Electric cars (Tesla Model 3) vs. hybrids (Toyota Prius): Shared eco-purpose and tech mechanisms; slight efficiency/context gaps. 3 Half-Similar (Moderate Balance) 41-60% Balanced split: Strong matches in 1-2 dimensions (e.g., core purpose), offset by equal variations elsewhere (e.g., scale/stakeholders differ). Thematic links exist but require caveats. Neutral (Useful metaphor, but “same” risks oversimplification—probe deeper.) Fighting animal cruelty vs. anti-patriarchy (as in query): Shared ethical advocacy (core +10%); divergent agency/context (-15%). 2 Mostly Different (Low Alignment) 21-40% Dominant variations in core/context (e.g., mismatched mechanisms/stakeholders), with isolated superficial overlaps (e.g., broad “struggle” theme). Comparison feels forced. Mostly False (Analogy breaks down; highlights contrasts better than parallels.) Democracy vs. monarchy: Both governance systems (outcomes +15%); but power structures/agency clash fundamentally (-30%). 1 Totally Different (High Variation) 0-20% Near-total divergence across all dimensions: No core overlap; contexts irrelevant; outcomes/opposed; nuances clash. Any link is poetic or erroneous. False (Classic fallacy; equating erodes credibility—reframe as opposites.) Poetry writing vs. tax auditing: Both “creative” in loose sense (+5%); but purpose, skills, impacts are worlds apart.
This scale promotes nuanced discourse: Start with the taxonomy to score, then select the point. For the animal cruelty vs. patriarchy example, it lands at Point 3 (Half-Similar) (~45% total), validating “similar yes, same no” while flagging false equivalence in absolute claims. Adapt weights for domain-specific use (e.g., emphasize ethics in social issues). If you’d like a scored example or digital tool (e.g., spreadsheet template), just say!
