Notes on the Chart
- Hierarchical Levels:
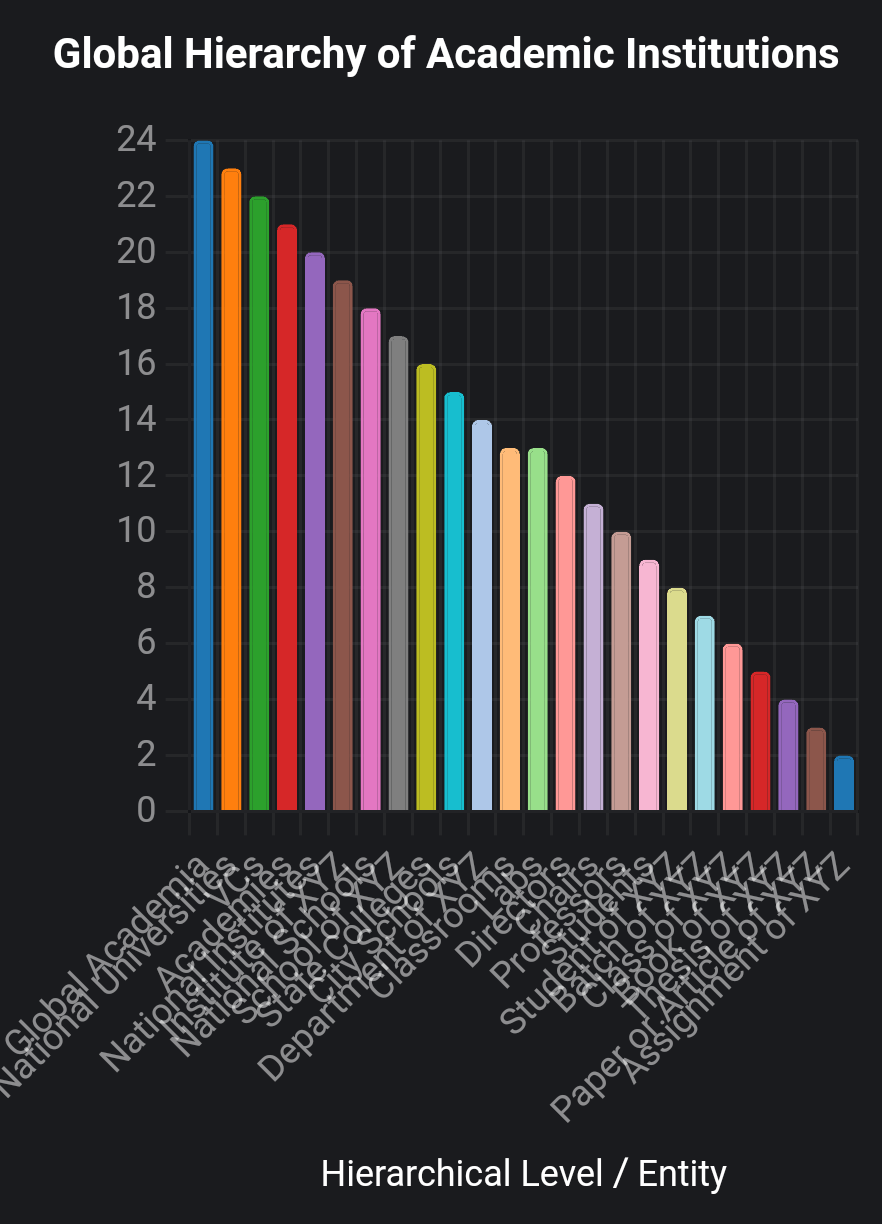
- Global Academia (24): Top level, representing global oversight (e.g., UNESCO, QS rankings).
- National Universities (23): Comprehensive institutions like Harvard, Oxford, NUS.
- VCs (22): Leaders like Harvard’s President or Oxford’s Vice-Chancellor.
- Academies (21): Prestigious bodies (e.g., National Academy of Sciences).
- National Institutes (20): Specialized institutions (e.g., MIT, IISc).
- Institute of XYZ (19): Field-specific institutes (e.g., Institute of Physics at Oxford).
- National Schools (18): Broad units (e.g., Harvard Medical School).
- School of XYZ (17): Specific schools (e.g., School of Engineering at Stanford).
- State Colleges (16): Regionally governed (e.g., UC-affiliated colleges).
- City Schools (15): Localized institutions (e.g., community colleges).
- Department of XYZ (14): Discipline-specific units (e.g., Department of Chemistry at Harvard).
- Classrooms/Labs (13): Teaching and research units, at the same level due to parallel roles.
- Directors (12): Leaders of institutes/schools (e.g., Director of IIT Delhi’s AI Centre).
- Chairs (11): Departmental heads (e.g., Chair of Physics at Oxford).
- Professors (10): Faculty delivering education and research.
- Students (9): General student body.
- Student of XYZ (8): Students in specific programs (e.g., Student of Computer Science at IISc).
- Batch of XYZ (7): Student cohorts by year (e.g., Batch of 2025 at IIM Ahmedabad).
- Class of XYZ (6): Course-specific cohorts (e.g., Class of Quantum Mechanics at MIT).
- Book of XYZ (5): Academic books (e.g., Book of Astrophysics by a Harvard professor).
- Thesis of XYZ (4): Student research theses (e.g., Thesis of AI at Tsinghua).
- Paper or Article of XYZ (3): Scholarly publications (e.g., Paper of Biotechnology from NUS).
- Assignment of XYZ (2): Student tasks (e.g., Assignment of Data Science at Oxford).
- Colors: Distinct colors ensure readability, with some reused for lower-level entities due to the large number of categories, but chosen to maintain visual distinction.
- Design: The x-axis labels are rotated 45 degrees for readability given the many entities. The y-axis uses a step size of 1 to clearly show hierarchical differences.
Connection to Previous Discussion
This chart aligns with the earlier analysis of why Indian institutes (e.g., IISc, IITs) and universities (e.g., JNU) struggle to compete with global peers like Harvard and Oxford. Entities like Institute of XYZ (e.g., IITs as Indian Institute of Technology) and Department of XYZ (e.g., Department of Physics at IISc) reflect the domain-specific nature of many Indian institutions, which limits their scope compared to comprehensive National Universities like Oxford. Linguistic barriers, as previously discussed, further impact entities like Paper or Article of XYZ, where Indian research output may lack global reach due to language polish or accessibility.
If you need a different visualization (e.g., a tree diagram, though not supported by Chart.js), modifications to the chart (e.g., specific examples for each entity), or additional data (e.g., recent global ranking updates), let me know!
