To frame an equation for positive or negative politics based on Secularism, Non-Nepotism, Citizen & Constitution Centrism, and other essential principles, we need to define these terms and their contributions to political quality, then integrate them into a conceptual framework. The equation will evaluate whether a political system or action leans toward positive (ethical, inclusive, and effective governance) or negative (divisive, corrupt, or exclusionary governance). I’ll include additional essentials like Transparency, Accountability, Inclusivity, and Evidence-Based Policy, as these are critical for robust governance. The equation will be qualitative, assigning weights to each factor based on their impact, with real-life context to ground the framework.
Defining the Components
- Secularism (S): Governance free from religious dominance, ensuring equal treatment of all beliefs. Example: France’s laïcité promotes neutrality (e.g., 2004 ban on religious symbols in schools). Contributes positively by fostering inclusivity; absence leads to division (e.g., Iran’s theocratic policies).
- Non-Nepotism (N): Merit-based appointments, avoiding favoritism toward family or allies. Example: Singapore’s meritocratic bureaucracy contrasts with cases like India’s political dynasties (e.g., Gandhi family prominence). Reduces corruption and enhances trust.
- Citizen & Constitution Centrism (C): Policies prioritizing citizen welfare and constitutional values like justice and equality. Example: Canada’s Charter of Rights (1982) ensures citizen-focused governance; contrast with authoritarian regimes ignoring constitutional checks.
- Transparency (T): Open access to government decisions and data. Example: Sweden’s Freedom of Information Act enables public scrutiny, while opaque systems like China’s limit accountability.
- Accountability (A): Mechanisms to hold leaders responsible. Example: U.S. impeachment processes vs. lack of accountability in Venezuela’s regime.
- Inclusivity (I): Ensuring marginalized groups are represented. Example: New Zealand’s policies for Māori inclusion vs. exclusionary policies like Myanmar’s Rohingya persecution.
- Evidence-Based Policy (E): Decisions grounded in data and reason. Example: Germany’s science-driven COVID-19 response (2020) vs. misinformation-driven policies elsewhere.
Framing the Equation
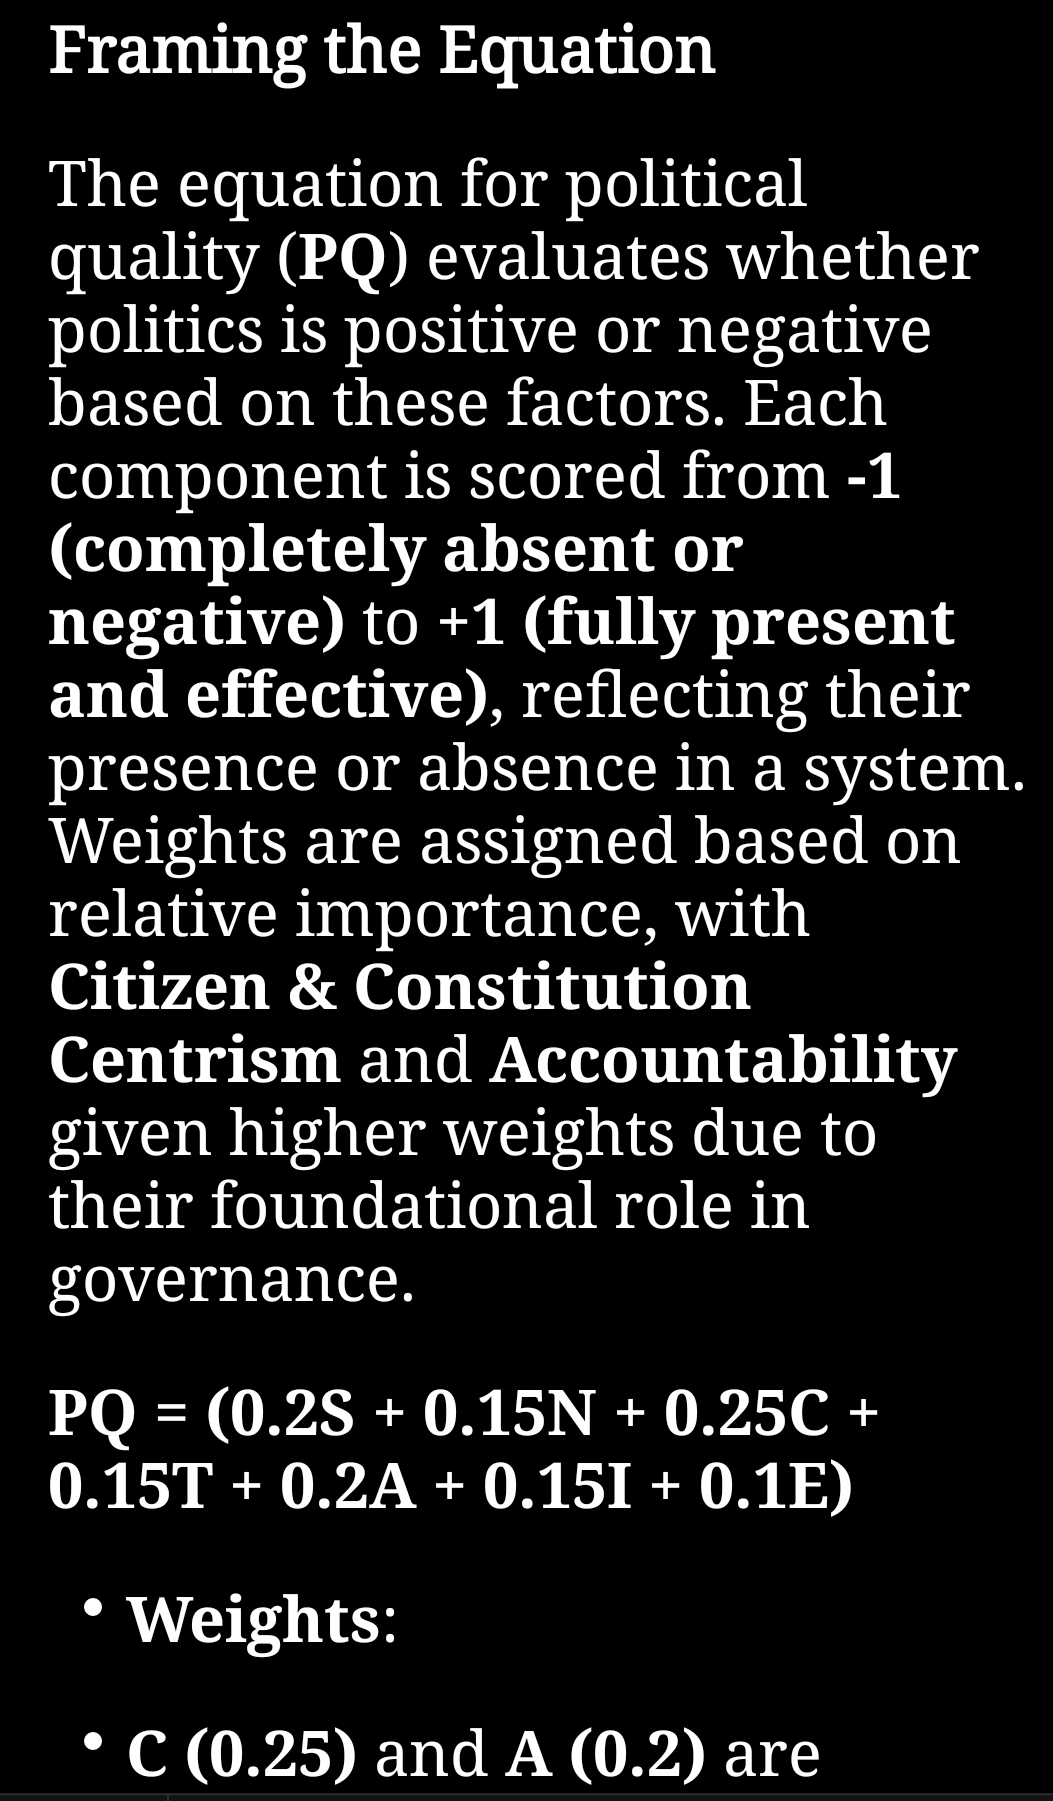
The equation for political quality (PQ) evaluates whether politics is positive or negative based on these factors. Each component is scored from -1 (completely absent or negative) to +1 (fully present and effective), reflecting their presence or absence in a system. Weights are assigned based on relative importance, with Citizen & Constitution Centrism and Accountability given higher weights due to their foundational role in governance.
PQ = (0.2S + 0.15N + 0.25C + 0.15T + 0.2A + 0.15I + 0.1E)
- Weights:
- C (0.25) and A (0.2) are critical for ensuring citizen welfare and checks on power.
- S, N, T, I (0.15 each) are vital but slightly less foundational.
- E (0.1) supports rational decisions but depends on other factors for implementation.
- Range: PQ ranges from -1 (highly negative politics) to +1 (highly positive politics).
- Threshold: PQ > 0 indicates positive politics; PQ < 0 indicates negative politics; PQ ≈ 0 suggests a mixed or neutral system.
Applying the Equation: Real-Life Examples
- Positive Politics: Sweden
- S (Secularism): +1 (secular culture, minimal religious influence; 2021 Pew: 80% non-religious).
- N (Non-Nepotism): +0.8 (merit-based system, minor nepotism in local politics).
- C (Citizen & Constitution): +1 (strong welfare state, constitutional protections).
- T (Transparency): +1 (robust freedom of information laws).
- A (Accountability): +1 (independent judiciary, free press).
- I (Inclusivity): +0.9 (strong minority rights, some integration challenges).
- E (Evidence-Based): +1 (data-driven policies, e.g., climate goals).
- Calculation: PQ = (0.2×1 + 0.15×0.8 + 0.25×1 + 0.15×1 + 0.2×1 + 0.15×0.9 + 0.1×1) = 0.2 + 0.12 + 0.25 + 0.15 + 0.2 + 0.135 + 0.1 = 0.955 (highly positive).
- Negative Politics: North Korea
- S: -1 (state atheism suppresses free belief).
- N: -1 (Kim dynasty nepotism dominates).
- C: -1 (citizen welfare ignored, no constitutional checks).
- T: -1 (no transparency, state-controlled media).
- A: -1 (no accountability, authoritarian rule).
- I: -1 (no inclusivity, dissenters punished).
- E: -0.5 (limited data use, ideology-driven).
- Calculation: PQ = (0.2×-1 + 0.15×-1 + 0.25×-1 + 0.15×-1 + 0.2×-1 + 0.15×-1 + 0.1×-0.5) = -0.2 – 0.15 – 0.25 – 0.15 – 0.2 – 0.15 – 0.05 = -0.95 (highly negative).
- Mixed Case: India
- S: +0.5 (constitutional secularism, but communal tensions; e.g., 2020 CAA debates).
- N: -0.5 (political dynasties common, e.g., Gandhi family, though merit exists).
- C: +0.7 (citizen-focused constitution, but uneven implementation).
- T: +0.3 (RTI Act exists, but bureaucratic opacity persists).
- A: +0.5 (independent judiciary, but political interference reported).
- I: +0.4 (diverse representation, but marginalized groups face challenges).
- E: +0.6 (data used in policies like Aadhaar, but misinformation issues).
- Calculation: PQ = (0.2×0.5 + 0.15×-0.5 + 0.25×0.7 + 0.15×0.3 + 0.2×0.5 + 0.15×0.4 + 0.1×0.6) = 0.1 – 0.075 + 0.175 + 0.045 + 0.1 + 0.06 + 0.06 = 0.465 (moderately positive).
Interpretation
- Positive Politics (PQ > 0): Systems like Sweden score high due to strong secularism, accountability, and citizen focus, fostering trust and inclusivity.
- Negative Politics (PQ < 0): Systems like North Korea score low, prioritizing ideology or power over citizen welfare, leading to oppression.
- Mixed Cases (PQ ≈ 0 to 0.5): Countries like India show potential for positive politics but face challenges like nepotism or inconsistent secularism.
Notes
- Scoring: Scores are illustrative, based on general trends and examples up to May 18, 2025. Real-world assessment would require detailed data.
- Flexibility: Adjust weights based on context (e.g., increase E for data-driven societies).
- Limitations: The equation simplifies complex political dynamics; cultural and historical factors may influence outcomes.
If you want to apply this to a specific country, refine weights, or visualize the data (e.g., a chart comparing countries), let me know!
